Lesson 14: How Confident Are You?
Lesson 14: How Confident Are You?
Objective:
Students will learn about informal confidence intervals and estimates for the margin of error.
Materials:
- Dotplot titled “Mean Word Length, Random Sample, Size = 10” – from Lesson 11
Vocabulary:
Essential Concepts:
Essential Concepts:
The margin of error expresses our uncertainty in an estimate. The estimate, plus or minus the margin of error, gives us an interval in which we are very confident the true value lies.
Lesson:
-
In this lesson, students will learn about confidence intervals in more detail.
-
Display the dotplot the class created during Lesson 11 (The Gettysburg Address) titled “Mean Word Length, Random Sample, Size = 10.”
-
Have students recall that each dot represents one student’s calculation of the mean word length of a sample of 10 randomly selected words from the Gettysburg Address.
-
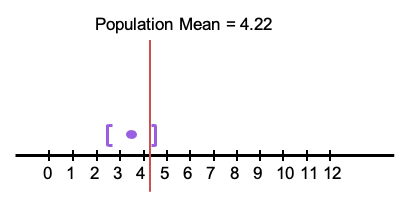
Also remind them that the population parameter, which is the mean word length of all words in the speech, was 4.22. There should already be a vertical line on the dotplot to indicate this value, but if it is not present, please add it during this step. Ask:
-
What vocabulary word was used to describe each of the sample means we each created during Lesson 11? The sample statistic. Every dot on the graph represents one sample statistic, more specifically each dot corresponds to a different sample mean.
-
How many of us got exactly the right value? Probably none.
-
Thinking back on The Confidence Game we played yesterday, what approach could we do so that 90% of us would be correct? We could give an interval.
-
-
Show students that they can give an interval in the form:
Your sample statistic plus or minus AMOUNT
-
Ask them to calculate what their AMOUNT must be so that their interval includes the parameter value. Ask them to write this as an interval.
-
Choose one student to illustrate what is to be done. Ask them for their AMOUNT. On the dotplot, find their value, and use bars to go out plus and minus the AMOUNT. Confirm that it includes the parameter value.
For example: The purple dot represents a sample mean of 3.5. The AMOUNT we have chosen for this particular case is 0.8, so the lower bracket is 0.8 below the sample mean, and the upper bracket is 0.8 above the sample mean. Notice that the population parameter is included within the brackets.
-
Now, convert this to an interval of the form [lowest value, highest value] by subtracting the amount from the sample statistic to get the lowest value, and adding to get the highest.
-
Inform students that this AMOUNT is called the margin of error. Explain that the students all now have different margins of error because in this unusual 'game' they know the population value. But in real life we do not, and so we have to choose one single margin of error that will work 90% of the time.
-
Ask the students what margin of error they should use so that 90% of the estimates will have a 'successful' interval. You might want to tell them how many estimates that is for your class. A ballpark figure for the margin of error is 1.3.
-
Explain: If we were to start all over, we could imagine picking one of these sample statistics at random.
- What's the probability that the sample statistic plus or minus the margin of error would include the parameter value? 90%.
-
Because of this, we call these 'confidence intervals.' When we report an interval, for example 2.7 to 4.3, we say "We are 90% confident that the population parameter value is between 2.7 and 4.3." This is another way of saying "We don't know what the exact true value is, but we're confident it is somewhere in this interval."
-
Remind students of the Pew Poll they discussed during Lesson 10. For reference, the Pew Research Center made the following statement in their August 2015 report titled Teens, Technology & Friendships: Pew Poll
“For today’s teens, friendships can start digitally: 57% of teens have met new friends online. The margin of error is plus or minus 3.7 percentage points. Social media and online gameplay are the most common digital venues for meeting friends.”
Note: The data for this report were collected via interviews of 1,060 teenagers between the ages of 13 and 17.
-
Now that students have learned about the margin of error, have them write an Exit Slip about what the margin of error means in context of the Pew Poll.
-
Conclusions and takeaways:
-
Estimates that are based on random samples vary.
-
We can measure this variation.
-
The margin of error can tell us how much estimates vary.
-
We can use the estimate from our random sample, along with the margin of error, to give us a range of plausible values for the population parameter. This is called a confidence interval.
-
-
If time allows, introduce students to the idea of bootstrapping, which is where we take random samples of really large samples. For example, if we were looking at Twitter data, it would be almost impossible to compile every single tweet that exists in the population. Instead, we might be able to access 500,000 tweets, which is a very large sample. From this sample, we could create smaller random samples of size 100 and make inferences about the overall population of tweets from these samples. This will be discussed further in Lab 3D.
Class Scribes:
One team of students will give a brief talk to discuss what they think the 3 most important topics of the day were.
Next Day
LAB 3D: Are You Sure about That?
Complete Lab 3D prior to the Let’s Build a Survey! Practicum.