Campaign Guidelines – Food Habits
Campaign Guidelines - Food Habits
1. The Issue:
Although we might take its existence for granted today, the Nutrition Facts label was not always required to be on food packages. It wasn't until 1990 that the Nutrition Labeling Education Act mandated food companies to provide information on food labels to help consumers make wiser choices about what they eat. This raises some interesting questions:
1) Does knowing nutritional information about my snacks help me change my habits?
2) What is my snacking pattern?
3) Do I tend to eat healthy? How do I compare to my class? How does my class compare to the rest of the country?
2. Objectives:
Upon completing this campaign, students will have the enduring understanding that interpreting graphs provides useful information about the real world as viewed through the data represented in the graphs. We can explore the relationship between two variables, and if there is a relationship, it is driven by the change in the independent variable, x, which causes a change in the dependent variable, y.
3. Survey Questions: (students will enter data about the snacks they consume):
Consider Data: Before students submit a survey for their first snack, a class consensus of the meaning of the variables must be reached so that proper analysis and interpretations can be made. Two examples are listed below:
when - If students have different definitions of "evening", it might make it hard to compare snacking patterns across students. As a class, come to a consensus about what time intervals are considered morning, afternoon, evening and night.
cost - If a student has a bowl of cereal as a snack, are they going to include the cost of the entire box or are they going to calculate the unit cost for one serving? This needs to be a class decision.
| Prompt | Variable | Data Type |
|---|---|---|
| What is the name of the snack? | name | text |
| When did you eat the snack? | when | categorical morning afternoon evening night |
| Is the snack salty or sweet? | salty_sweet | categorical Salty Sweet |
| How healthy is the snack? (1 = Very unhealthy, 5 = Very healthy) |
healthy_level | numerical 1 2 3 4 5 |
| How many calories per serving? | calories | numerical |
| How many grams of protein per serving? | protein | numerical |
| How many grams of sugar per serving? | sugar | numerical |
| How many milligrams of sodium per serving? | sodium | numerical |
| How many ingredients are in your snack? | ingredients | numerical |
| Why are you eating the snack? | why | categorical availability craving emotional energy hungry/thirsty social other |
| How much does the snack cost (in dollars)? | cost | categorical $0 to < $1 $1 to < $3 $3 to < $7 $7 or more |
| Take a picture (optional). | snack_image | photo |
| AUTOMATIC | location | lat, long |
| AUTOMATIC | time | time |
| AUTOMATIC | date | date |
| AUTOMATIC | user | user id |
When should you take the survey? If possible, take the survey every time you eat a snack or at the end of the day. Reminders can be set to ensure survey completion.
How long should the campaign last? About nine days. Ideally, two of these days will include a weekend.
4. Motivation:
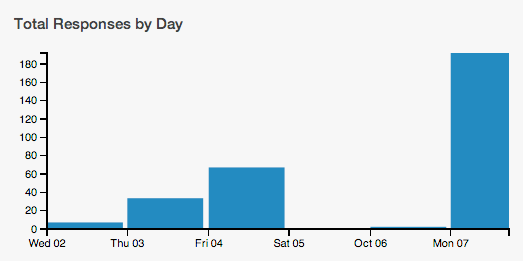
As a class, come to an agreement about how many surveys each student should submit. All students should submit roughly the same number of surveys, and each student should submit at least four surveys. After the first day, use the Campaign Monitoring tool to see who has collected data. After two to three days, direct students’ attention to the Total Responses by Day plot and comment on any patterns. For example, if they see a plot like the one below, ask "What story does this tell us about our data collection?”
Story: They collected a lot of data together in class. Data collection increased every day from Wednesday to Friday. There was little to no data collection over the weekend. Data collection peaked on Monday - there were over 180 responses!
Discuss data collection issues. What makes it hard? Does this affect the quality of data? What sort of snacks are you less likely to enter?
5. Technical Analysis:
Students will use the Dashboard and Plot App as well as RStudio.
6. Guiding Questions:
a. At what time of day do we eat the healthiest snacks?
b. When did you snack? How does this compare to the rest of the class?
c. Typically, how healthy were your snacks? How does this compare to the class as a whole?
d. What were some of the characteristics of healthy snacks? What about unhealthy snacks?
7. Report:
Students will complete a practicum in which they answer a statistical investigative question based on the Food Habits data collected.