Lesson 11: This AND/OR That
Lesson 11: This AND/OR That
Objective:
Students will understand how AND/OR probabilities are defined and will be able to use frequency tables to compute these probabilities.
Materials:
-
Compound Probabilities handout (LMR_2.13_Compound Probabilities)
-
Blue sticky notes
-
Gold sticky notes
-
Four signs on the board labeled: Pickles, Mayonnaise, Both, None (in that exact order, and equally spaced across the length of the board)
Vocabulary:
Essential Concepts:
Essential Concepts:
What does "A or B" mean versus "A and B" mean? These are compound events and two-way tables can be used to calculate probabilities for them.
Lesson:
-
Remind the students that they have been learning about estimating probabilities of single events based on sample proportions. Inform them that, today, they will learn how to calculate proportions when multiple events happen.
-
Review the basic idea of computing probabilities; in other words, the number of outcomes we are interested in divided by the total number of outcomes possible.
-
Pose the questions below to the class.
Note: They do not need to come up with specific answers; this is a time for them to make suggestions.
-
How would we compute the probability of two outcomes occurring at the same time? For example, what is the probability that a randomly chosen student likes both pickles AND mayonnaise?
-
How would we compute the probability of either of two outcomes occurring? For example, what is the probability that a randomly chosen student likes either pickles OR mayonnaise?
-
-
For both questions, steer the students towards using the definition from Step 2. That is, we want the students to realize that they can count the number of people that qualify for the given circumstance and divide by the total number of people to calculate a probability.
-
In order to define AND/OR probabilities, students will participate in an activity where they are grouped by their food preferences.
-
Divide the board into 4 groups and write the words “Pickles,” “Both,” “Mayonnaise,” and “None,” in that order, from left to right.
-
Ask for 10 volunteers to stand by the word that represents their preferences. That is, if they only like pickles, they should stand by the word “Pickles.” If they like both pickles and mayonnaise, they should stand by the word “Both.”
Note: If all 4 groups do not have at least one student in them, select a few more students to stand at the board.
-
Ask the remaining students (those still seated) to count the total number of people standing by the board and have a student volunteer share the answer with the class. Answers will vary by class.
-
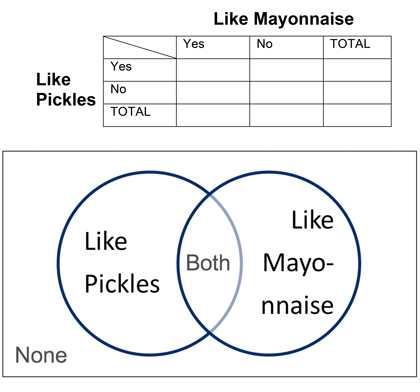
Next, create a 2-way frequency table like the one below to organize the values of student preferences as follows:
-
Counts for students who like both go in the Yes/Like Mayonnaise and Yes/Like Pickles box.
-
Counts for students who like none go in the No/Like Mayonnaise and No/Like Pickles box
-
Counts for students who like only mayonnaise go in the Yes/Like Mayonnaise and No/Like Pickles box.
-
Counts for students who like only pickles go in the No/Like Mayonnaise and Yes/Like Pickles box.
Note: A Venn diagram like the one below may be used as well, depending on student understanding and at teacher discretion.
-
-
Next, ask the students sitting down the following questions:
-
How many students like both pickles AND mayonnaise? Answers will vary by class.
-
What is the probability that a randomly selected student at the board likes both pickles AND mayonnaise? Answers will vary by class. The probability should be calculated by dividing the number of people who are standing under “Both” (number given in Step 9(a)) by the number of students at the board (number given in Step 8).
-
-
Now, ask a student from the audience:
-
How many students like pickles? Answers will vary by class.
Note: Avoid phrasing the question with “Students that like ONLY pickles.” Students need to see that students who like “Both” items also belong to the groups liking the individual items.
If students mistakenly report the number of students who like ONLY pickles, ask the people at the board to raise their hands if they like pickles and then ask the mistaken student to recount.
-
What is the probability that a randomly selected student at the board likes pickles? Answers will vary by class. The probability should be calculated by dividing the number of people who are standing under “Pickles” and “Both” by the total number of students at the board.
-
-
Finally, ask one more student from the audience:
-
How many students like pickles OR mayonnaise? Answers will vary by class.
Note: Avoid phrasing the question with “Students that like ONLY pickles OR ONLY mayonnaise.”
If students mistakenly report the number of students who like ONLY pickles plus the students who like ONLY mayonnaise, ask the people at the board to raise their hands if they like either pickles or mayonnaise (All students at the board should raise their hand except for the students who like “None”) and then ask the mistaken student to recount.
-
What is the probability that a randomly selected student at the board likes pickles OR mayonnaise? Answers will vary by class. The probability should be calculated by dividing the number of people who are standing under “Pickles,” “Mayonnaise,” and “Both” by the total number of students at the board.
-
-
Informs students that AND/OR probabilities are called compound probabilities. In teams, have students record their own definitions of AND/OR probabilities based on the activity they just completed. A compound probability is the probability of some combination of events occurring.
-
Distribute the Compound Probabilities handout (LMR_2.13).
-
Pass out a blue sticky note to each student who plays a sport and a gold sticky note to each student who does not play a sport.
-
Draw the table from the worksheet on the board (make it large and legible).
-
Have each student who plays a sport hold up their sticky note. Count them and record the number of students who play a sport in the appropriate row of the TOTAL column in the table.
-
Have each student who does not play a sport hold up their sticky note. Count them and record the number of students who do not play a sport in the appropriate row of the TOTAL column in the table.
-
Ask each student which of the following ice cream flavors they most prefer (each student must choose exactly one option): Vanilla, Chocolate or Rocky Road.
-
Have the students write their ice cream preference on their sticky note.
-
Fill out the remainder of the table by asking each group of students, those who play a sport and those who do not, to hold up their preference.
-
Make sure the totals for preferred ice cream flavors and sports involvement add up to the same number.
-
-
Instruct the students to work in pairs to answer the questions on the Compound Probabilities handout (LMR_2.13).
Class Scribes:
One team of students will give a brief talk to discuss what they think the 3 most important topics of the day were.
Homework & Next Day
If not completed in class, students should finish the Compound Probabilities handout (LMR_2.13).