Lesson 9: Dice Detective
Lesson 9: Dice Detective
Objective:
Students will learn how to use simulations to detect an unfair die.
Materials:
-
Poster paper – with 6 columns labeled 1, 2, 3, 4, 5, 6
-
2 dice (number cubes)
Note: You can use regular hard dice, or soft foam dice (can be found at dollar stores)
-
Projector for RStudio functions
Essential Concepts:
Essential Concepts:
In the short-term, actual outcomes of chance experiments vary from what is 'ideal.' A fair die has equally likely outcomes. But that does not mean we will see exactly the same number of one-dots, two-dots, etc.
Lesson:
-
In pairs, ask students to quickly share their Tweets from the previous lesson’s homework. Collect the Tweets and select a few to share with the class. Of the Tweets shared, ask students which one is closest to the definition: probability measures how often something happens in the “long run.”
-
Remind students that, during the previous lesson, they were introduced to simulations. The progression following this path: chance → probability → simulations. The motivation for using simulations is that we can use the calculated sample proportions to estimate probabilities of reallife events.
-
During today’s lesson, we will be continuing to learn about probability and simulations to determine if an event is not fair (one example: a coin is weighted and lands on heads more often than tails).
-
Ask students what they know about dice (number cubes). If they have never heard of them, show one to the class and explain how it works. A die (number cube) is a 6-sided cube. Each face of the cube is labeled with dots to represent a number between 1 and 6. For example, if the face has 3 dots, then it represents the number 3. The cube itself is weighted so that there is an equal probability of rolling each of the 6 numbers.
-
Have a discussion about what the students would expect the probability of rolling the number 1 should be if a die (number cube) were tossed into the air and allowed to fall back to the ground (or table). Since there are 6 numbers on the die, each number should be equally likely to occur, so the probability of rolling a 1 is 1/6.
-
Display a piece of poster paper on the board with columns labeled 1, 2, 3, 4, 5, 6. Explain that each column represents the numbers on the die (number cube). We will be using poster to tally the results of actual dice (number cube) rolls.
-
Select two students to be dice (number cube) rollers and give each student one die. As noted in the Materials section above, you can have the students use either regular hard dice, or softer foam ones (can be found at dollar stores).
-
Tell the class that each student roller will be rolling the dice 6 times (so there will be a total of 12 rolls for our sample). Ask:
-
If they are rolling the dice 6 times, how often do you think Student 1 will roll a 3? Would you expect it to be the same for Student 2? Out of 6 rolls, we would expect to see each of the numbers one time, so we will most likely see about one 3 for Student 1.
-
Would you expect the Student 2 to roll a 3 just as often? Why? Yes, we should expect the same thing from Student 2 because we have independent events. There are actually two ways that independence plays a part here: (1) each student is independent from the other and has no effect on what the other will roll, (2) the 6 die rolls for Student 1 are all independent of each other because each face of the cube has an equal chance of happening on any given roll. So, if Student 1 gets a 3 during his/her first roll, that doesn’t give us any information about what he/she will get on the second roll.
-
Since we will have 12 rolls (and therefore 12 samples), how many tally marks should we expect in each column on the chart? We would expect to see 2 tally marks in each column (each number will probably be rolled twice).
-
-
Have each student roller toss his/her die one time and share the outcomes with the rest of the class. As they do this, place a tally mark in the corresponding column on the chart. Repeat this process 5 more times so that each student has a total of 6 rolls.
-
As a class, observe the results in the chart and discuss the following:
-
Do the data from these 12 rolls match what we expected (see responses from Step 8)? Is this surprising? Answers will vary by class. Some values may have shown up more than we expected (example: the number 3 was rolled 3 times), and others may not have been rolled at all (example: the number 5 was never an outcome). We only have a small sample of data, so it’s not surprising for our results to vary from the expected outcomes.
-
If the data do not match our expectations, does this mean the dice are unfair in some way? Even if they don’t match our expectations, this does not mean the dice are unfair – we simply don’t have enough data yet to know. We would need to roll the dice more.
-
If we wanted to purposely create an unfair die, what are some ways we could achieve that? Answers will vary by class. Some examples include: (1) We could add tape to one face of the die to give that side more weight. This would increase the chances of the number that is directly opposite of it appearing because the die will land on the heavier side more (and therefore the side facing up will be the number opposite). (2) We could chip the edge of one corner of the die. This would throw off the original balance and favor certain sides.
-
-
Similar to the previous day’s lesson with coin flipping, we can also simulate dice rolls in RStudio. The function required is called roll_die(). The arguments for this function are a bit different than the rflip() function from yesterday. We cannot simply put roll_die(1) for the computer to roll a die one time. Instead, the function was built with 2 possible dice to choose from – die A and die B.
-
Inform the students that one of the dice in the function is fair and the other is unfair. A die is unfair if it favors one outcome over another. They will attempt to determine which dice is the unfair one by doing multiple simulations.
Note to Teacher: Many simulations require multiple functions, or code, to perform. This is where RScripts are helpful. An RScript can be used to test code, write notes, and let us easily execute multiple lines of code at one time. This would be a good place to introduce students to RScripts.
-
Using a projector to display your computer screen to the whole class, demonstrate how to open an RScript. Type the following function on your script and click Run. Run simply pastes the function onto the console.
roll_die(“A”, times = 1) -
The output will show one number that represents what value on the die the computer rolled. Go back to your script and modify the function to roll die A 12 times.
roll_die(“A”, times = 12) -
Compare the results of these 12 simulated rolls to the results of the 12 actual rolls completed by the two students during Step 9. If there is space available on the tally chart, you can add the computer results to it for an easy comparison.
-
Ask students how we could record data from these simulations if we wanted to roll the die 100 times. Would they want to hand count the number of times each value occurred? Is there a function in RStudio that will count them for us? It would be difficult to count every individual value in the output on the screen. However, we can use the tally() function to find out how many times each die value appeared.
-
To make using the tally() function easier, we should assign a name to each simulation so we don’t have to type the entire function multiple times. We can also have it calculate the proportions for each value. Add the functions below to your RScript and run them one at a time.
sample1 <- roll_die(“A”, times = 100) tally(sample1) tally(sample1, format = “proportion”) -
Remind the students that if the die is fair, then each side of the die should appear roughly the same amount of times. Therefore, the proportions should be fairly similar to each other and to the true probability of 1/6.
-
Add the function below to your script, but before running it, ask the students what they think a histogram of the simulated data might look like and then run the command on your screen. Note: Be sure to include the argument nint = 6 so that the resulting histogram has six bars. If the die is fair, each of the bars in the histogram should be roughly the same height.
histogram(sample1, nint = 6)Note to teacher: Show students how to save an RScript. Inform students that they can take notes on their RScript by including a hashtag (also known as a pound sign or #) at the beginning of the note. Data scientists refer to these types of notes as “code comments” or simply “comments”. See image below.
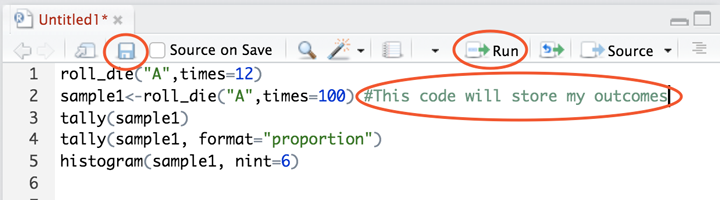
The Script will be stored in the files tab. To run each function individually, place your cursor on the line and click the Run button. To run multiple lines of code at once, highlight them and click Run.
-
Allow the students to access their school computers now to start creating their own simulations in an RScript using die B. Students can pair up, if needed. Have them begin by asking RStudio to roll the die 100 times. They should note their output from both the tally() function and the histogram. They can then compare the results to those from Step 14. Are they similar? Can they determine which die is unfair yet? Answers will vary by class. The results will be similar, but not exact. With the sample sizes of each simulation being fairly small, we cannot see a clear difference between the two dice yet.
-
Let the students explore by changing the number of times RStudio rolls the dice. Remind them that the goal is to determine which of the two dice is unfair. The sample sizes need to be very large in order for them to see a clear difference between the 2 histograms. The pattern becomes more visible when times = 2000.
Note: The maximum value for
timeswithin theroll_die()command is 2000. Simulations can be combined using the concatenate functionc(). For example, suppose s1 represents 2000 rolls of die A and s2 is a second sample of 2000 rolls for die A. To combine these two samples the following can be usedmore_rolls <- c(s1, s2) -
When students have had enough time to make a decision regarding which dice is unfair and how, engage the class in a discussion to verify that everyone agrees. Die B is unfair; Die A is fair. Die B favors the number 3.
-
Then, steer the conversation towards why the sample size affected the results. The sample size needed to be large because the difference between the probabilities of the die rolls was very small. In order to detect small differences, we must have larger sample sizes.
Class Scribes:
One team of students will give a brief talk to discuss what they think the 3 most important topics of the day were.
Homework
Students will consider a four-sided die and imagine rolling it 20 times. They should sketch a histogram of (a) the ideal, expected outcome, (b) an outcome that they think is “realistic,” and (c) an outcome they might see if the die were unfair such that it produced more 4’s.