Practicum: The Summaries
Practicum: The Summaries
Objective:
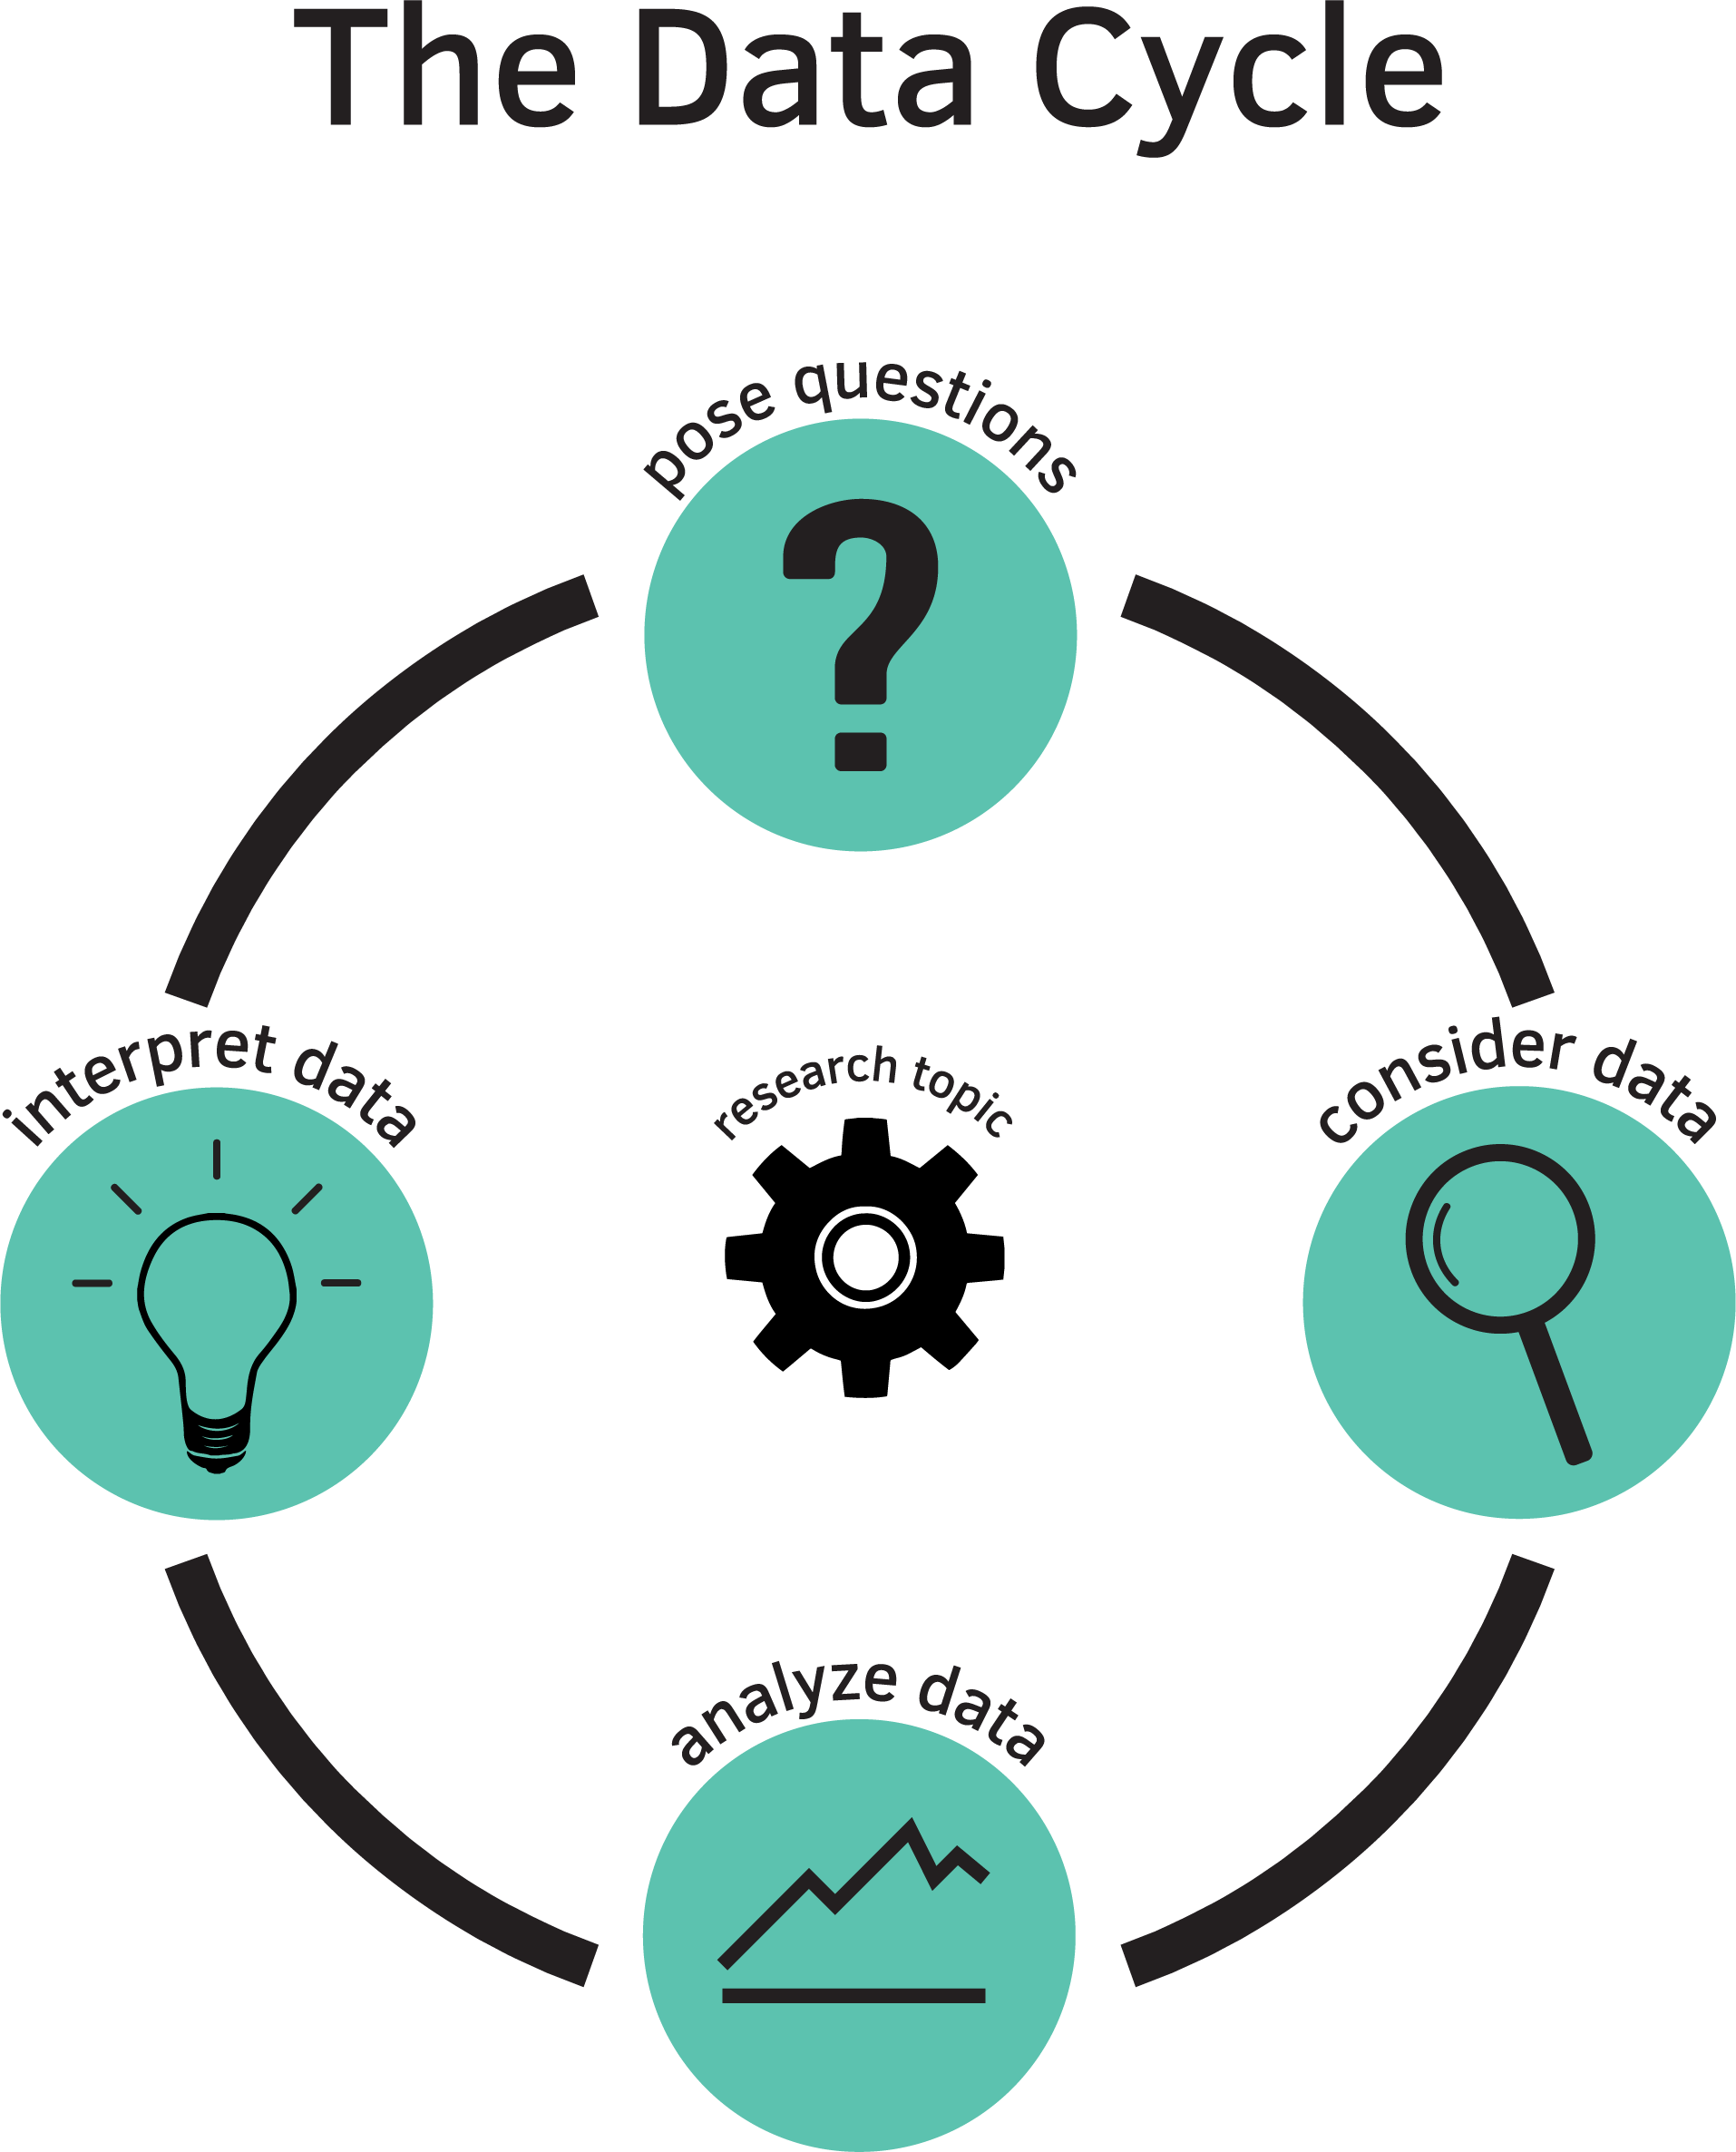
Students will engage in their first statistical investigation using the Data Cycle. They will pose a statistical investigative question based on a data set from a Participatory Sensing campaign, analyze, and interpret the data.
Materials:
- The Summaries Practicum (LMR_U2_Practicum_The Summaries)
Note to Teacher: Before assigning the practicum to your students, engage the class in a discussion about the sample statistical investigative questions below. Guide the discussion so that students identify not only the groups being compared in each question, but also what is being compared about the groups. Remind them of the Data Cycle from Unit 1.
Using the Food Habits campaign data or Personality Color survey data, develop a new statistical investigative question that compares two or more groups. Some sample statistical investigative questions (about other data sets) are below:
-
Which gender shows a bigger range in age, male or female Oscar winners?
*** Grouping variable: gender (male, female)***
*** Variable: ages***
-
Do children, teenagers, or adults spend more money on candy?
Grouping variable: age group (child, teenager, adult)
Variable: the amount of money spent on candy
-
How does the median height of teenage males compare to that of females?
Grouping variable: gender (male, female)
Variable: height
-
How do the average temperatures of Los Angeles, Las Vegas, and San Francisco compare?
Grouping variable: city (Los Angeles, Las Vegas, San Francisco)
Variable: daily maximum temperature
Remember, a statistical investigative question is one that anticipates variability in the question and then addresses the variability in the answer:
Based on the data you chose (Food Habits or Personality Color), you need to:
-
Write down your question and think about ways you could answer it using RStudio.
-
Describe the data you are using to answer your question and explain why it is appropriate.
-
Analyze the data to provide evidence that supports the answer to your question. Include plot(s) and numerical summaries (mean, median, MAD, IQR, etc.) related to your plots.
-
Interpret the data to answer your statistical investigative question. You should:
a. Provide the plot(s) and numerical summaries related to your plot(s).
b. Describe what the plot shows.
c. Explain why you chose to make that particular plot(s) and the related numerical summaries.
d. Explain how the plot and numerical summary answer your statistical investigative question.
-
Write and submit a one-page report.
Note: You may use the scoring guide in Unit 1 to give you an idea of how to score the Practicum.