Lesson 1: Trash
Lesson 1: Trash
Objective:
Students will learn about reducing the burden of trash landfills.
Materials:
-
Video: Fighting Pollution Through Data Video found at:
https://www.youtube.com/watch?v=xOYAIXjHveA -
Landfill Readiness Questions handout (LMR_4.1_Landfill Readiness Questions)
-
Trash Campaign Exploration handout (LMR_4.2_Trash Campaign Exploration)
-
Trash Campaign Creation handout (LMR_4.3_Trash Campaign Creation)
Essential Concepts:
Essential Concepts:
Exploring different datasets can give us insight about the same processes. Data from our Participatory Sensing campaigns rely on human sensors and limit the ability to generalize to the greater population.
Lesson:
-
Inform students that they will investigate a problem that faces many cities around the world today: trash.
-
Using the 5 Ws strategy, ask students to write down the 5 Ws in their DS journals as they watch a video about trash. The 5 Ws summarize the What, Who, Why, When, and Where of the resource.
-
Play the Fighting Plastic Pollution Through Data video, found at: https://www.youtube.com/watch?v=xOYAIXjHveA
NOTE: While the video is just over 13 minutes long, students should be able to answer the 5 Ws from the content of the first 10 minutes. -
After they have finished watching the video, engage in a class discussion around the following questions and discuss their insights, questions, and/or reactions to the video:
-
What types of data did they collect in the video? Answer: Photos, location, brand names, weight (kg), waste categories (plastic bags, straws, toothpaste, etc), and number of packaging.
-
How are they useful in fighting plastic pollution? Answer: Brand accountability, community involvement, cleaning rivers/ dumping sites, and finding sources of pollution.
-
-
Now we'll take inventory of our own understanding of landfills and how trash travels there. Distribute the Landfill Readiness Questions handout (LMR_4.1_Landfill Readiness Questions). Allow students private think-time before having them discuss in their teams.
-
Let students know that they will be exploring data from a trash Participatory Sensing campaign, titled the “Trash Campaign,” that was conducted at a number of high schools in the Los Angeles Unified School District (LAUSD).
-
Concerned students in LAUSD engaged in a model eliciting activity and created a trash participatory sensing campaign to investigate possible trash issues in their communities. Based on the data collected, they made recommendations to the Los Angeles County Sanitation District (LACSD) that would help reduce the use of the regional landfills.
-
Distribute the Trash Campaign Exploration handout (LMR_4.2_Trash Campaign Exploration) to assist in students' interaction with the IDS public dashboard.
-
Navigate students to the IDS public dashboard: https://portal.idsucla.org
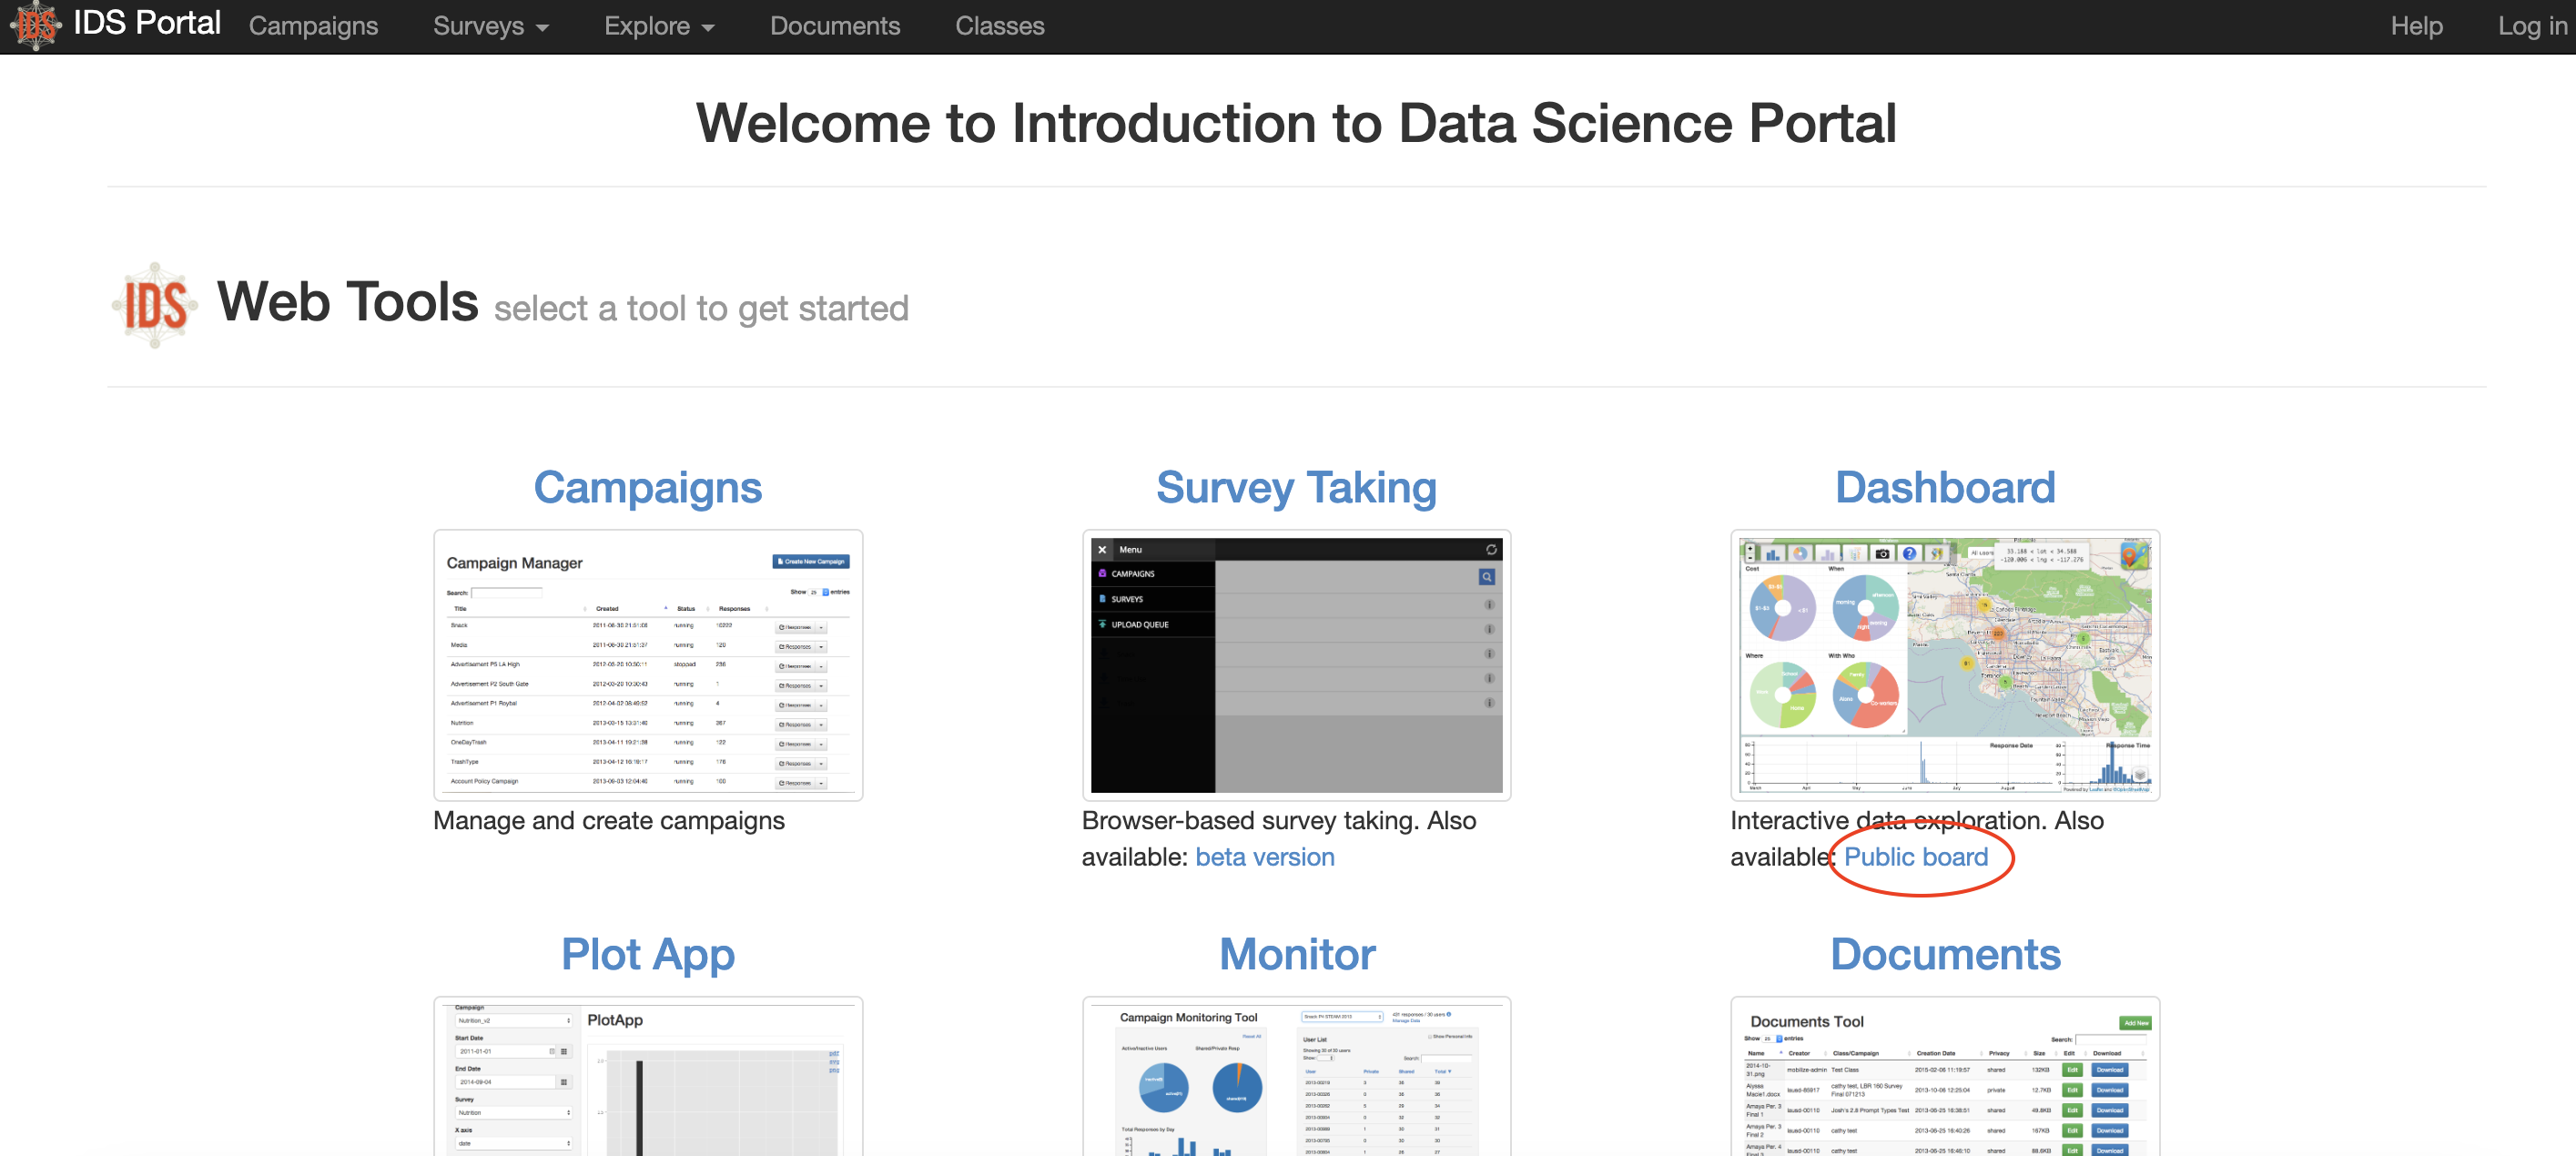
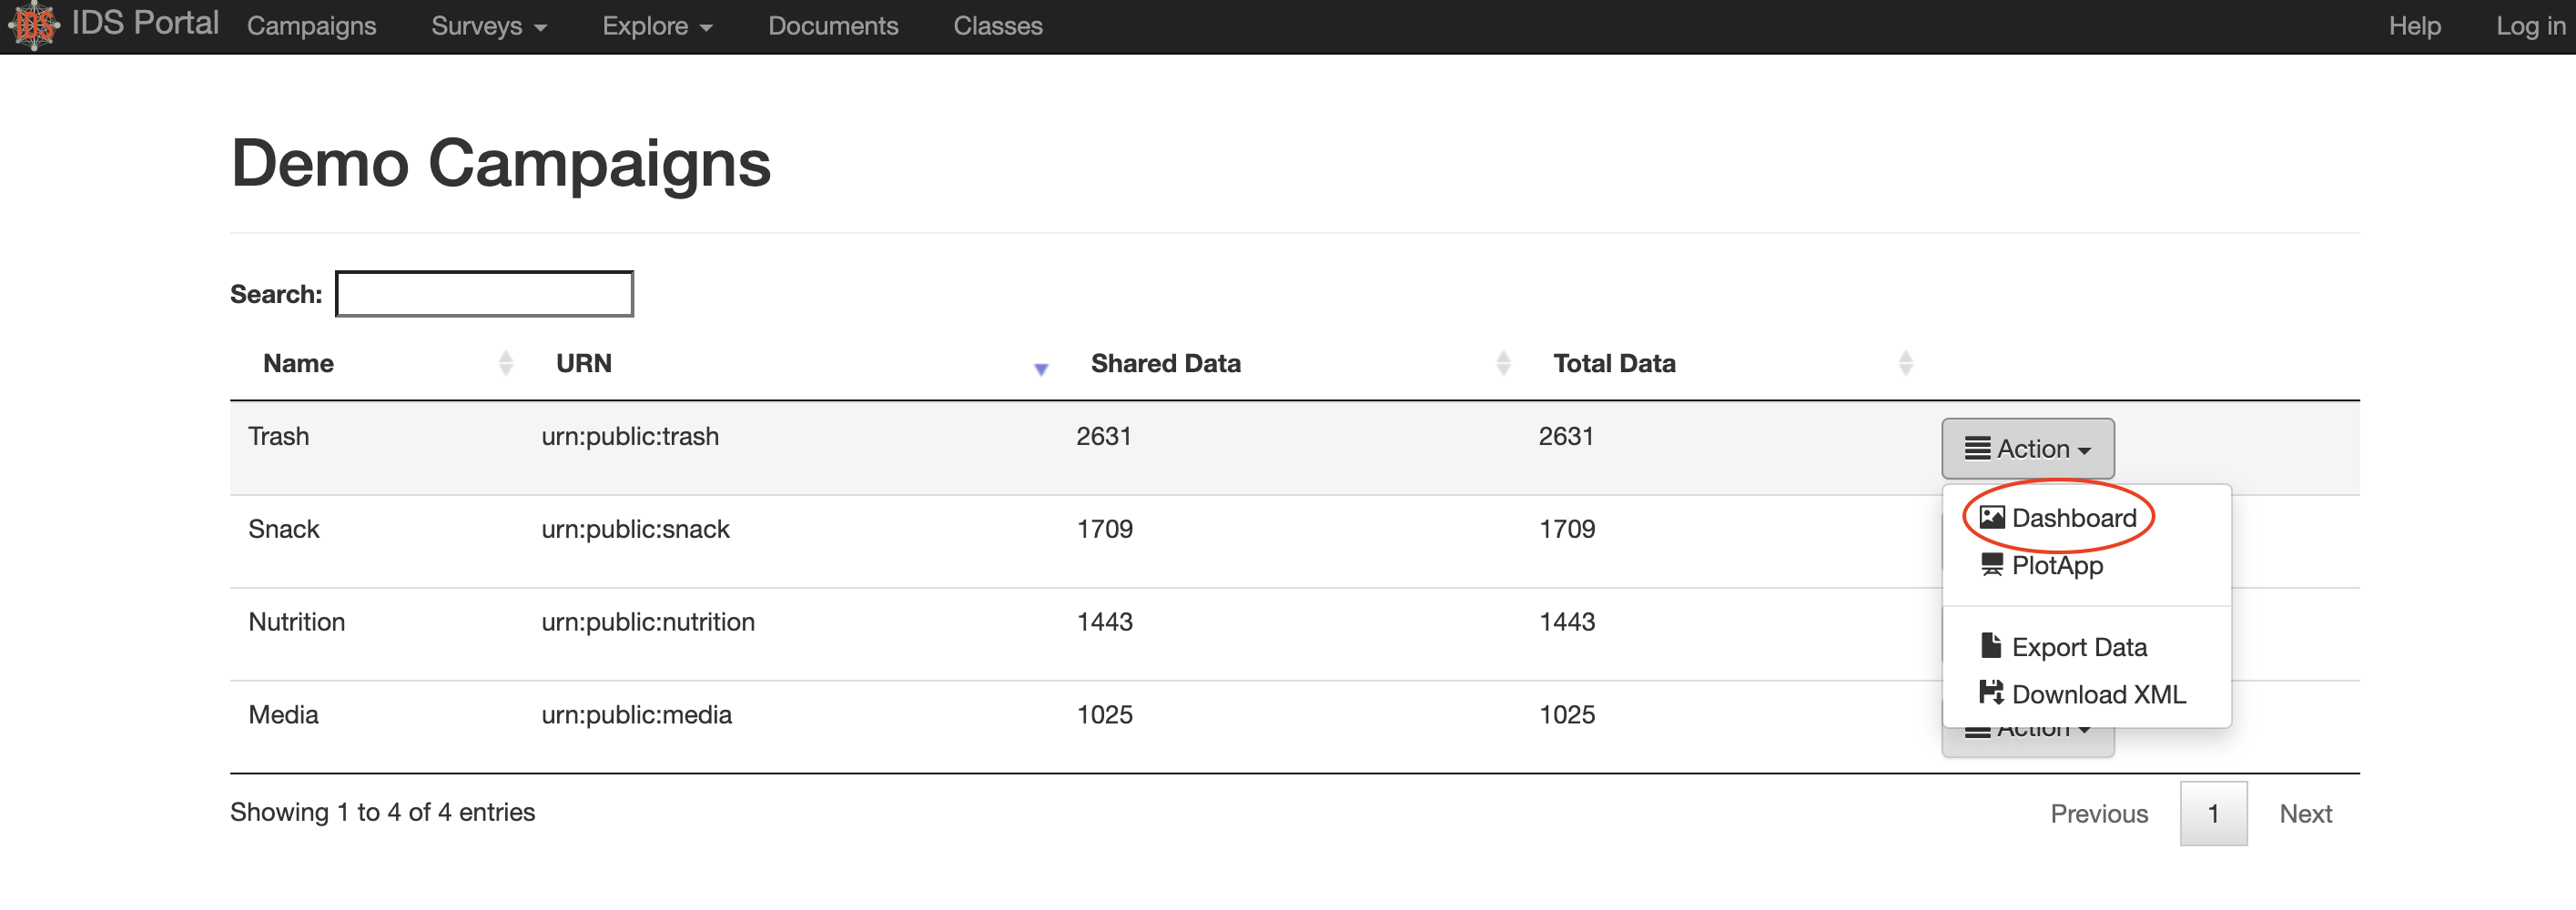
-
They should use the “Trash” campaign data and select “Dashboard” from the “Action” button.
-
The dashboard is a visual tool for exploring and analyzing data. An example screenshot of the Trash campaign in the dashboard is shown below.
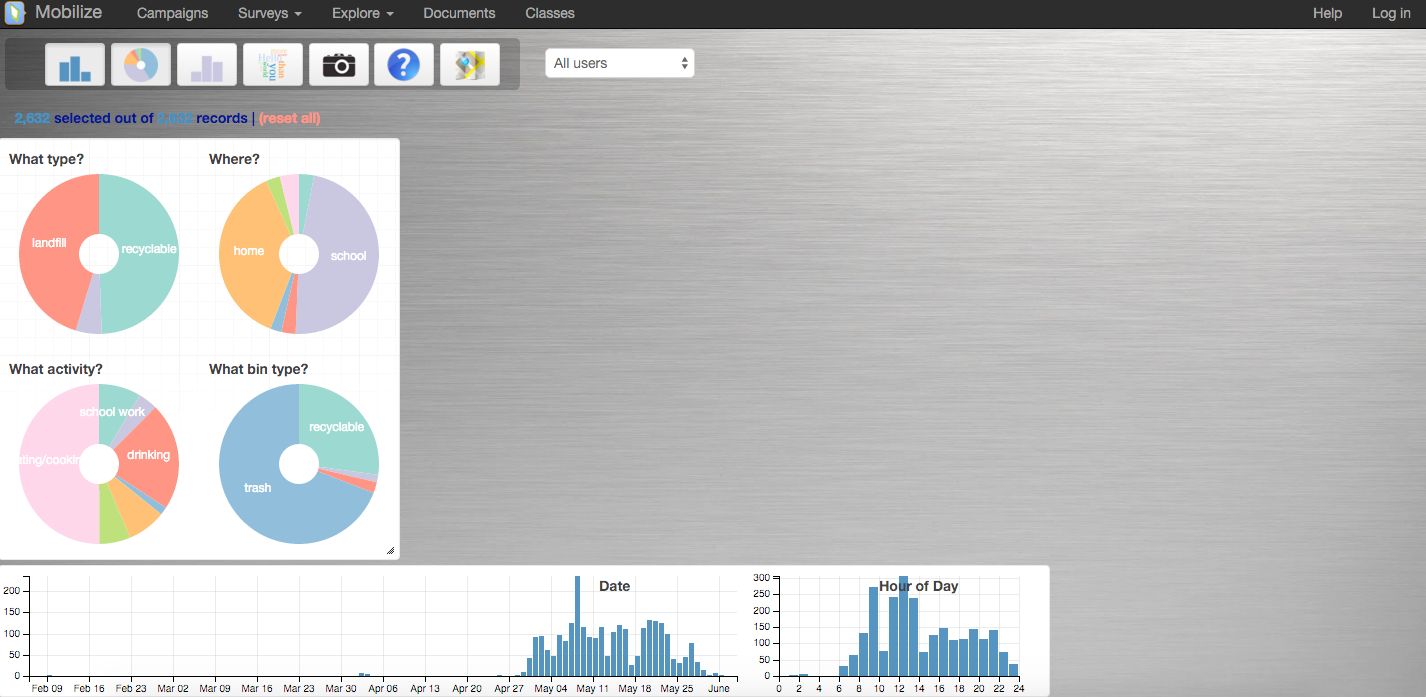
-
Students should “play” with the data and think about characteristics of the campaign. Answers to the questions in the Trash Campaign Exploration handout (LMR_4.2_Trash Campaign Exploration) are provided here for reference:
-
How many observations are in this data set? Answer: 2,631.
-
Where was the majority of trash generated? Answer: School (1,254).
-
How many observations were generated at school? At work? Answer: School has 1,254 and Work has 59.
-
What material or item was most commonly thrown away? Answer: Recyclable (1,302) or Paper (477).
-
Between what hours is the largest percentage of trash generated at home? Answer: Between 2100 and 2200, which is 9pm to 10pm (106).
-
Which activity generates the largest percentage of landfill-destined trash? Answer: Eating/cooking with 69.02% (822/1,191).
-
Is eating or drinking more likely to generate a recyclable piece of trash? Answer: Drinking, because it resulted in 480 recyclables versus Eating resulted in 399 recyclables, out of 1,302 total.
-
When recycle bins were present, what percentage of time did a recyclable item end up in a trash bin? Answer: 26.6% (225/846).
-
When recycle bins were present, did a higher proportion of recyclable items end up in the trash bin when people were at home or at school? Answer: School (134/225) had a higher proportion of recyclable items end up in the trash than Home (76/225).
-
When someone littered, how many times was the person not arround any type of waste receptacle? Answer: 15 out of 58.
-
-
Take time at the end of class to share out and discuss the components of the Trash Campaign. If needed, you may use the Trash Campaign Creation handout (LMR_4.3_Trash Campaign Creation) as an additional resource to help with the deconstruction of the Trash Campaign.
Class Scribes:
One team of students will give a brief talk to discuss what they think the 3 most important topics of the day were.