Lesson 15: Combination of Variables
Lesson 15: Combination of Variables
Objective:
Students will learn that we can make better predictions by including more variables. Then they will wrestle with how the information should be combined.
Materials:
Essential Concepts:
Essential Concepts:
If multiple predictors are associated with the response variable, a better predictive model will be produced, as measured by the mean squared error.
Lesson:
-
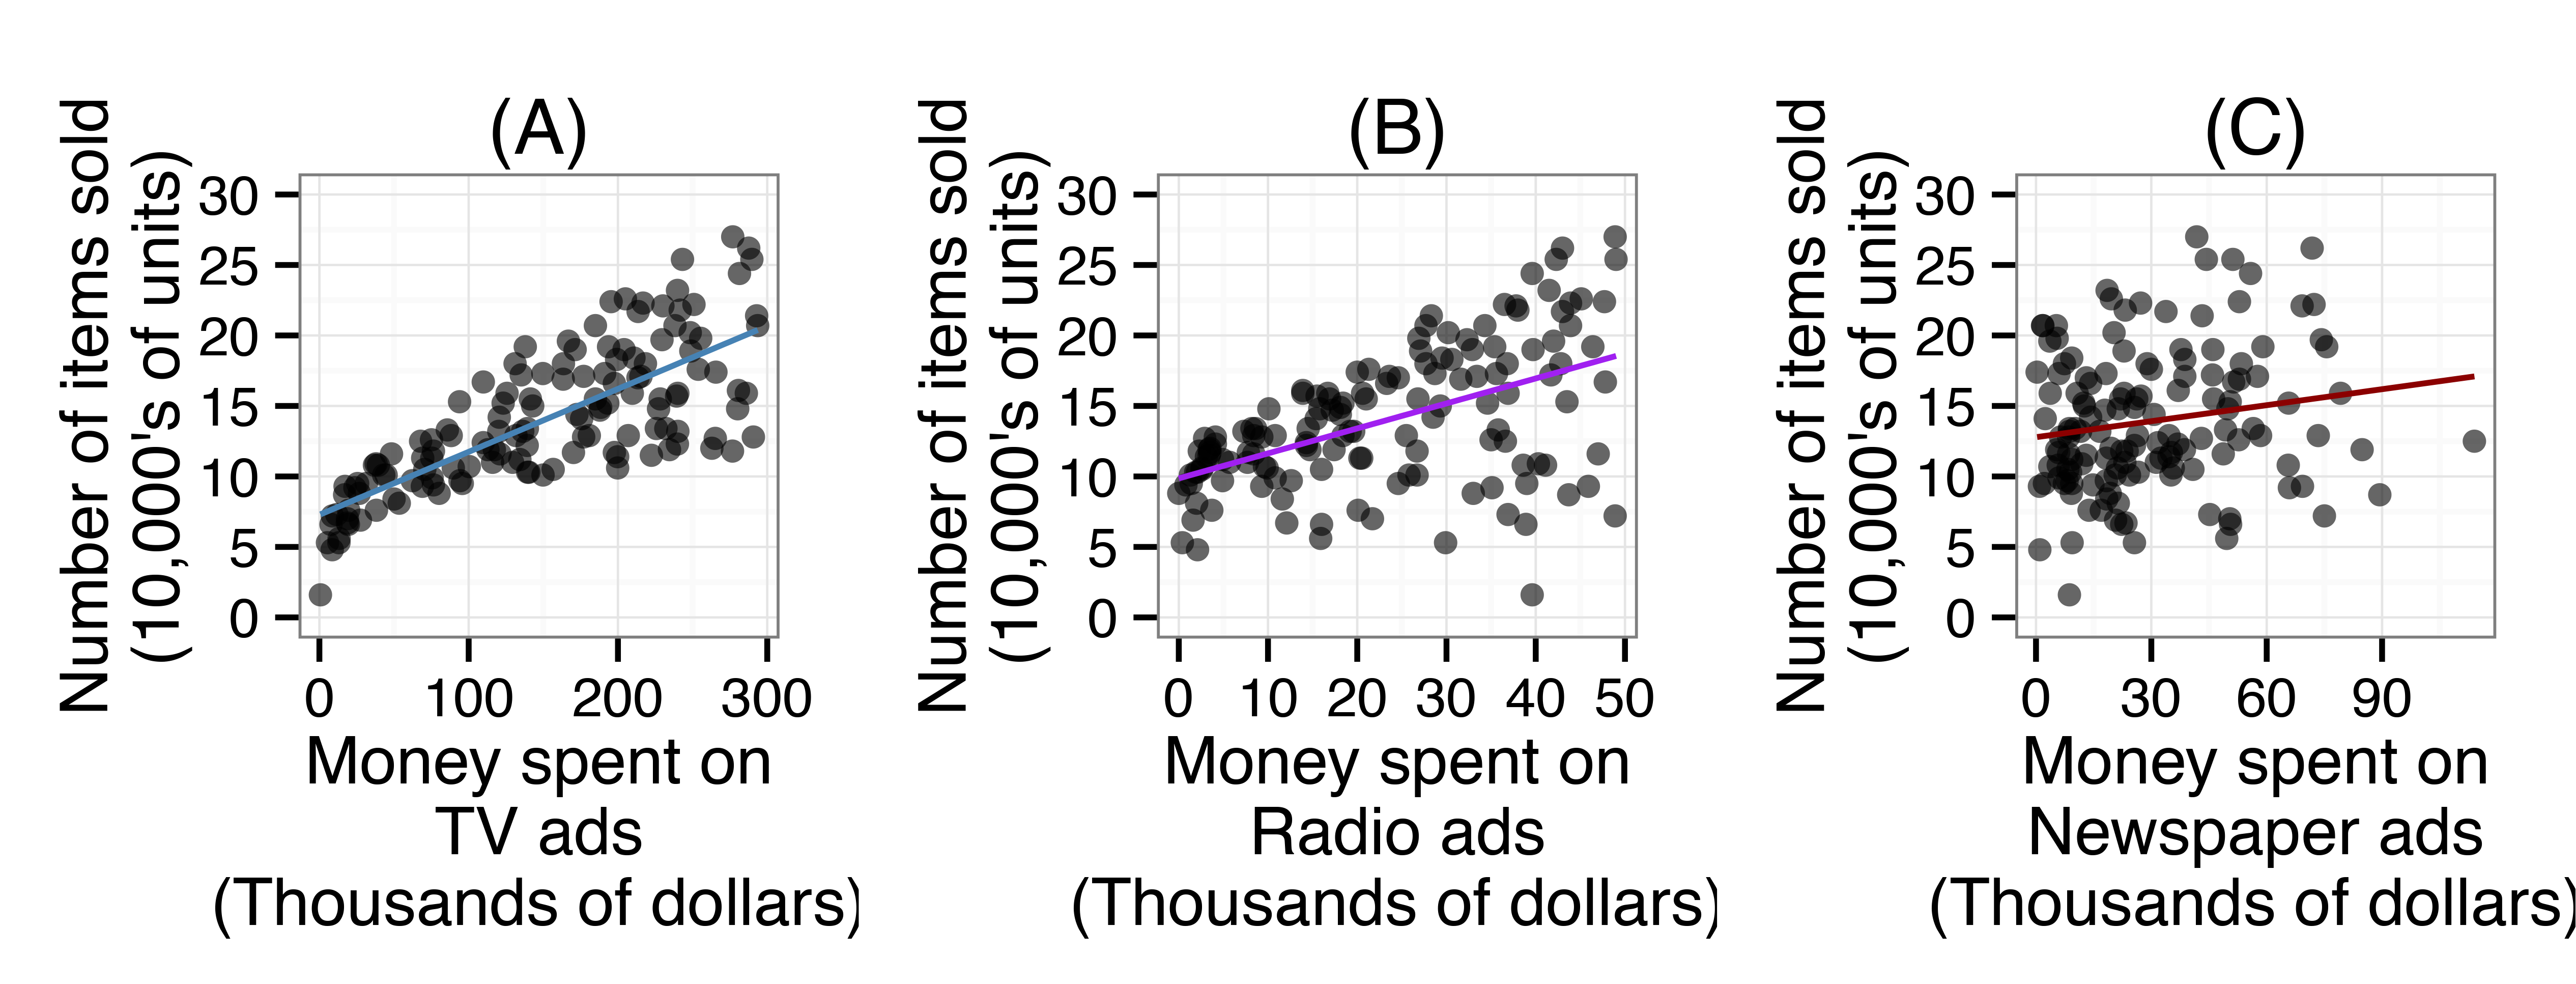
Display the plots and statements from the previous day:
-
Combining multiple variables (e.g., money spent on TV and Newspaper ads, TV and Radio ads, TV, Radio, and Newspaper ads, etc.) into one model will lead to worse predictions because the variables that make poor predictions will contaminate those that make good predictions.
-
Combining multiple variables (e.g., TV and Newspaper ads, TV and Radio ads, TV, Radio, and Newspaper ads, etc.) into one model will lead to better predictions because the model can use more information to make predictions.
-
-
Ask the students to share out their opinions using the Agree/Disagree strategy.
-
Next, inform teams that they will have 2 minutes to come up with as many combinations of ads (variables) as they can think of (e.g., TV + Newspaper ads, TV+ Radio ads, TV + Radio + Newspaper ads, etc.)
-
After 2 minutes, list all the different combinations by conducting a Whip Around and eliciting a combination from each team.
-
By a show of hands, ask students to select which combination or single model will be the best predictor for the number of items sold by the retailer.
-
Then inform students that we will determine which of the statements is true by comparing the mean aquared error (MSE) of single models (like the ones we showed in the previous lesson) vs. combined models. But first, use the line of best fit for the combined variables:
Note: The function that produced the line of best fit using RStudio was
lm(Sales ~ TV + Radio + Newspaper, data= retail)-
Use this equation to predict the amount of sales for the same market they circled in the previous lesson. Student calculations should yield the predicted value in (b), below.
Note: Remind students that they need to substitute the values as they appear in the x-axis of the plots without converting to thousands of dollars. For example, the circled market spent about 10 thousand dollars on newspaper ads, so students should substitute 10 instead of the expanded value in the equation.

-
Does the predicted value (10.81224) seem like a plausible number of sales? Why? Answer: It is not a plausible number of sales because the prediction is too high. The prediction says the retailer will sell about 108,122 units, when the actual sales were about 16,000 units. Although the model did not make a very good prediction for this market, it is not surprising because as LMR_4.18 displays, that market did not fit the overall pattern in any of the scatterplots.
-
-
Reveal that RStudio calculated the mean squared error for different combinations plus the single models, and the results are displayed on the table below. This means that, for example, when using the TV model to predict number of items sold, our predictions will typically be off by about 3.373579 (in 10,000s) of units or 33,736 units. Then ask students the questions below.
Note: Remember that the MSE will always be in square units. In order to convert back to the original units, simply take the square root of the MSE.Model Mean Squared Error (MSE) Square Root MSE TV 11.38103 3.373579 Radio 25.35521 5.035396 Newspaper 31.44164 5.607285 TV-Radio 4.456745 2.1111 TV-Newspaper 9.246567 3.040817 Radio-Newspaper 27.26889 5.221963 TV-Radio-Newspaper 4.70338 2.168728 -
Which model is the best predictor of number of items sold? Answer: The TV-Radio model is the best predictor of number of items sold because it had the least amount of error, on average. When using the TV-Radio model to predict number of items sold, our predictions will typically be off by 21,111 units.
-
Which model was the least reliable in predicting the number of items sold? Answer: The Newspaper model is the least reliable predictor of number of items sold because it had the most amount of error, on average. When using the Newspaper model to predict number of items sold, our predictions will typically be off by 56,073 units.
-
What else do you notice about the models? Answer: It appears that combining the variables into one model is much better than any of the single-variable models.
-
-
Think back to our statements from the last lesson and the beginning of this lesson:
-
Combining multiple variables (e.g., TV and Newspaper ads, TV and Radio ads, TV, Radio, and Newspaper ads, etc.) into one model will lead to worse predictions because the variables that make poor predictions will contaminate those that make good predictions.
-
Combining multiple variables (e.g., TV and Newspaper ads, TV and Radio ads, TV, Radio, and Newspaper ads, etc.) into one model will lead to better predictions because the model can use more information to make predictions.
Engage students in a discussion to check understanding of multiple variables in a model.
-
Has their statement selection changed or stayed the same? Why?
-
What evidence do they have to support their statement selection? Answers will vary because students can make an argument for either statement, both statements, or neither statements being true. There is evidence in step 7 that supports that more variables will lead to worse predictions (like TV-Radio-Newspaper) but there is also evidence that more variables lead to better predictions (like TV-Radio).
-
-
Inform the students that, in the next lab, they will find out how to create the line of best fit for models that include many variables.
Class Scribes:
One team of students will give a brief talk to discuss what they think the 3 most important topics of the day were.
Homework & Next Day
Ask students to think of a reason or reasons about why it would not be a good idea to make a scatterplot for models that include more than 3 predictor variables? The answer is mainly because humans are limited to seeing things in 3 dimensions. For example, the model that combines all of the variables together is a 4 dimensional model. What does that look like?